Analyse-Software VisionWorksLS
Original Analyse-Software für den Einsatz mit den Advanced Imaging Systemen von UVP.
Zur Bearbeitung und Archivierung von fluoreszierend markierten oder farbmetrisch gefärbten Gelen, Flecken und Membranen.
Angebot anfordernVisionWorksLS Analyse-Software
Software Features:
- Image Acquisition Controls
- Advanced Analysis Tools
- Fluorescence Calibration Instrument
- One-Touch Macros
- User Defined Templates
- Support for 21 CFR Part 11 Compliance
- Extensive Image Enhancement Capabilities
- User Defined Profiles and Preferences
- Detailed Report Generation
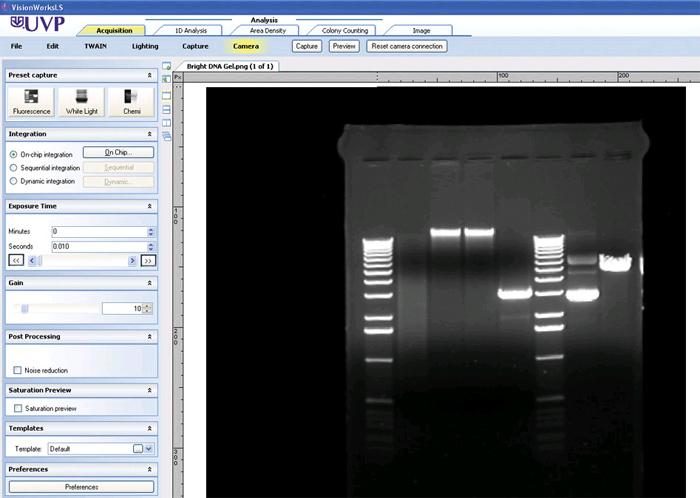
Image Acquisition
The VisionWorksLS image capture function is configured to work with UVP's Advanced Imaging Systems. Capture images (change pic to "camera") of any fluorescently labeled or colorimetric stained gels, blots, and membranes. For chemiluminescent imaging, acquire chemiluminescent Western, Northern and Southern blot images without using radioisotope labeled 32P and film. UVP's cameras are selected for their high resolution and sensitivity for image capture as well as for the ability to control the capture settings. The integrated software menu allows selection of functions to achieve superior captured images. The user friendly software guides you through steps for capture of images.
- Integration functions include on-chip integration for the simplest image capture
- Sequential integration captures multiple pictures taken at a uniformly increasing exposure time. Dynamic integration captures images at set intervals
- Binning allows a quick preview of the image before continuing with a longer full resolution exposure
- Saturation preview assures imaging results are quantifiable by detecting over-exposure of bands in live preview
- Imaging templates allow for creation of custom settings to enable quick image capture with reproducible results
- AutoExpose enables the perfect image exposure to be captured automatically below the saturation level of every pixel in the image for the widest dynamic range possible and the best quantitative analysis of bands
Saturation Warning
Assure imaging results are quantifiable by using the saturation warning to to detect saturation of bands in live preview.
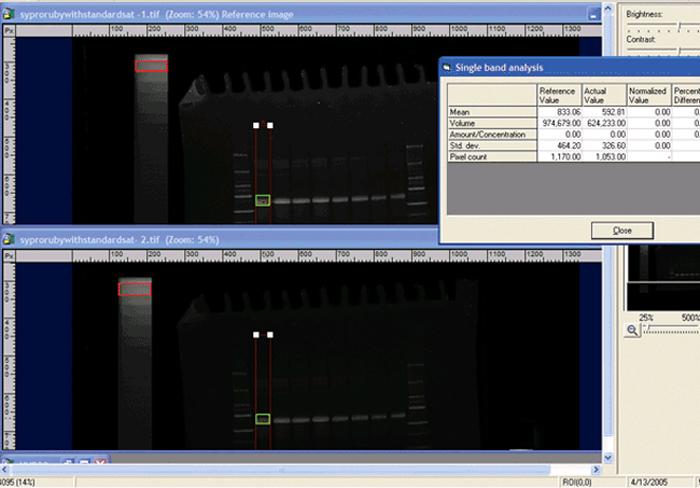
1D Lane Densitometry and Analysis
VisionWorksLS analysis software includes comprehensive tools to provide a full range of analysis capabilities. VisionWorksLS enables image acquisition and analysis for a wide range of applications including chemiluminescence, fluorescence, bioluminescence, colorimetric, and live animal samples. The easy to use functions automate your experiment analysis with accurate quantitation, generation of lane profile graphs, plus intensity histograms, concentration curves and much more!
Maximizing Fluorescence Calibration
Using a non-photobleaching fluorescent standard step tablet placed on a FirstLight UV Illuminator, users can normalize the control and treatment regions (bands and spots) on acquired images again one another for varioution in lighting and optical conditions. Images taken with the steptab can be analyzed with sophisticated statistics including mean and standard deviation, modified entropy and volume.
One-Touch Automated Macros
Create your own macros to automate time consuming routine procedures involving image capture, enhancement, analysis and data archiving. Record keystrokes that perform a series of complex functions within the software. Assign a function key to recorded macros for one-touch automation. The macros simplify operations for repeat procedures and to prevent user errors. To use the macros capability, a sample recorded macro follows:
- Name and describe the macro
- Acquire an image for analysis
- Record the keystores required for analysis
- Save the custom macro
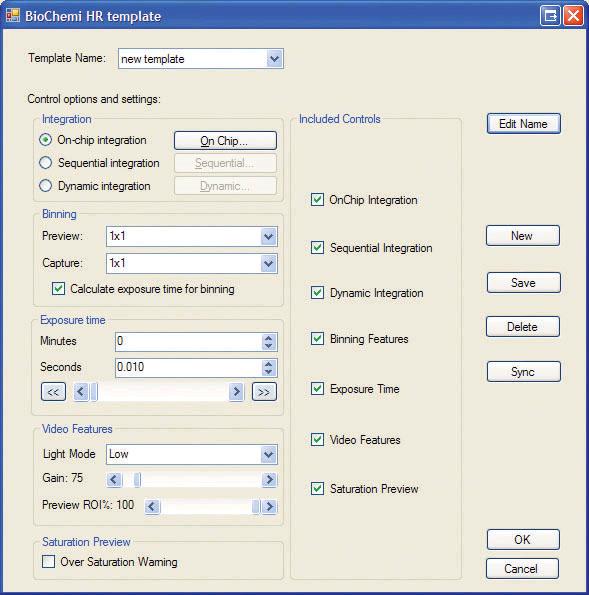
User Defined Templates
Researchers can personalize their workspace preferences and save the profiles by user name. Also set up user accounts with passwords to protect user data. User defined templates are great time savers and allow users to set the darkroom and camera settings to quickly and easily capture a wide range of samples. Also select from several pre-set capture templates which includes a template for acquiring a series of multiple exposures of chemiluminescent Western blots.
Support for 21 CFR Part 11 Compliance
VisionWorksLS Software supports image security and change logs to assist with 21 CFR Part 11 compliance.
- Track image and analysis history and show image properties and user comments
- Control of account set-up by Administrator, determine usernames and passwords, as well as permissions for viewing and editing images
- Maintain login history of all accounts
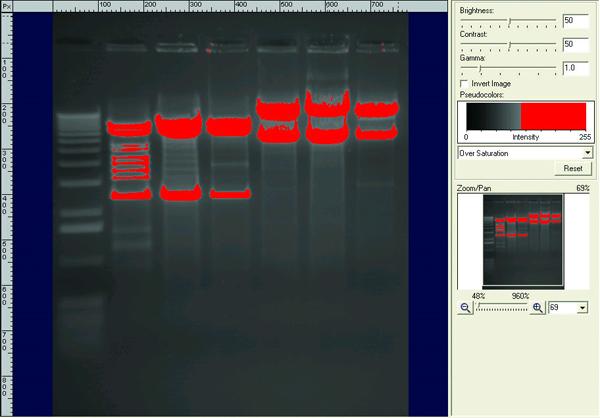
Image Enhancement Capabilities
VisionWorksLS offers many image enhancement features, process filters and annotation capabilities as non destructive tools for visualization and publication (click links below for large screen images).
- Enhance images with brightness, contrast, gamma, emboss, invert and pseudo color crop image so top control boxes do not show
- Annotate with text, lines, arrows, ellipse, and highlighter tools; show, hide or burn into image
- Select from filters to sharpen, blur and remove frequency based noise
User Profiles and Preferences
Researchers can personalize their workspace by placing tool bar icons along the side or across the top, with or without text. Then save the profiles by user name. Set up user accounts with passwords to protect user data.
Report Generation
- Save images as various file formats including TIFF, JPEG, BMP, TGA, PNG and GIF for use in presentations or documentation
- Create detailed and user-configured reports showing extensive analysis results on MW, Rf, precise position of bands, band intensities, etc.
- Use the Filter Data button to choose specific data for reports
- Configure the Quick-Link icon to automatically open an external software application
- Export data to Microsoft Excel or simple-text using Dynamic Data Exchange (DDE)